João V. Tomotani
Universidade de São Paulo; São Paulo, Brazil.
Email: t.jvitor (at) gmail (dot) com
https://doi.org/10.5281/zenodo.10644717
In a previous paper, I presented a curious experiment of a fish playing Pokémon, made real and popular thanks to the wonders of the Internet (Tomotani, 2014). The Twitch Channel (Twitch, 2016), which sadly has been inactive for some time now, showed Grayson, the fish, playing Pokémon Red with the help of an image identification software, and was watched by millions of people (Johns, 2014). I showed that, when assuming that a fish player was the same as a random input of commands – a premise I do not find absurd – it would take quite a while to advance through a single route (although a very complex one) in the game (Fig. 1): circa 115,700 years.
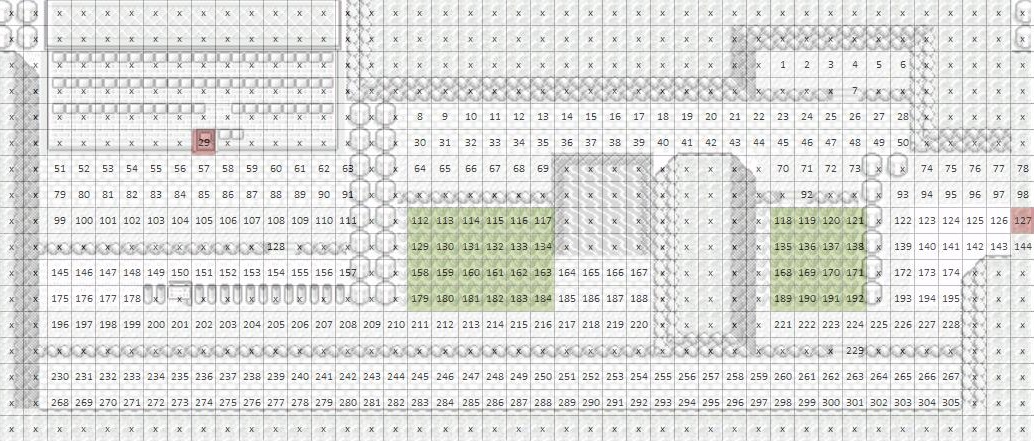
Figure 1. Route 23; image taken from Tomotani (2014). The many ledges, which could make the path much more tortuous, made the Twitch Play community come up with the infamous name “Ledge Simulator”.
The peculiar premise of a fish playing Pokémon obviously derived from the original Twitch Plays Pokémon, a game of Pokémon Red where everyone watching the stream could type commands in the chat window. An IRC bot would read and execute the commands in the game. The available commands were the classic Gameboy keys: A, B, Up, Down, Left, Right, Start and Select.
Since the inputs came from rational human beings, with defined intentions and minimal coordination, supposedly the game should be less frustrating than watching a fish swimming and randomly inputting commands in the game – the key word in this phrase being “supposedly”.
The point is (besides, of course, the difficulty in coordinating thousands of people to avoid incorrect commands), not all of the people participating in the event wanted to complete the game. In fact, some of them wanted to make matters as difficult as possible for the other players, as their goal was solely to make the Twitch Plays Pokémon a frustrating experience for anyone wanting to be a crowdsourced Pokémon master. (In their “defense”, I find it hard to believe that this sort of behavior was not one of the intentions of the programmer of this game, described by him as a “social experiment”; Alcantara, 2014.) This group of people is given the name of trolls.
The impact of trolls on Twitch Plays Pokémon was so peculiar that it resulted in a curious work, where Machine Learning techniques were used to detect anomalous inputs in the game (from a base of 38 million data points), trying to identify potential trolls (Haque, 2014). The objective of the present study is to see exactly how the percentage of trolls inputting commands on Twitch Plays Pokémon affected the time for completing Route 23 in the game.
TROLLS
Trolls are creatures from Nordic and Scandinavian myths and folklore, made popular in the 20th century by pop culture, starting with J.R.R. Tolkien’s books, going through Dungeons & Dragons and Harry Potter to the thousands, possibly tens of thousands, of other novels, comics, games etc. which they inspired.
Troll is a term applied to the Giants of Norse Mythology (the Jötnar), a race that live in Jötunheimr, one of nine worlds in Norse cosmology. There is some confusion about the terms, though, as jötunn (the singular form of Jötnar), troll, þurs, and risi frequently overlap and are used to describe many beings in the legends. Some researchers point out that there are distinct classes of these creatures, but the terms are frequently considered synonyms in late medieval literature and all of them are frequently translated to English simply as “giant” (Jakobsson, 2005). In a late saga of the Icelanders (Bárðar saga Snæfellsáss; probably from the early 14th century), a passage at the very beginning claims that risi and troll not only are distinctive races, but are, respectively, at the opposite ends of the binary divide of good and evil (Jakobsson, 2005).
The Internet term “troll”, however, does not come from such creatures. The term “trolling” means luring others into pointless and time consuming discussions, deriving from the practice used in fishing where a baited line is dragged behind a boat (Herring et al., 2002).

Figure 2. Trollface, a popular internet meme based in “rage comics”. – Did you just read two paragraphs about creatures in Norse mythology that have absolutely nothing to do with this topic?
The idea of trolling always seems to be related to communication, mostly computer-mediated communication (CMC). Hardaker (2010) analyzed a 172-million-word corpus of unmoderated, asynchronous CMC to try to formulate an academic definition of trolling. After his analysis, he proposes that:
“A troller is a CMC user who constructs the identity of sincerely wishing to be part of the group in question, including professing, or conveying pseudo-sincere intentions, but whose real intention(s) is/are to cause disruption and/or to trigger or exacerbate conflict for the purposes of their own amusement. Just like malicious impoliteness, trolling can (1) be frustrated if users correctly interpret an intent to troll, but are not provoked into responding, (2) be thwarted, if users correctly interpret an intent to troll, but counter in such a way as to curtail or neutralize the success of the troller, (3) fail, if users do not correctly interpret an intent to troll and are not provoked by the troller, or, (4) succeed, if users are deceived into believing the troller’s pseudo-intention(s), and are provoked into responding. Finally, users can mock troll. That is, they may undertake what appears to be trolling with the aim of enhancing or increasing affect, or group cohesion.”
― Hardaker, 2010: p. 237.
The definition of “trolling” for the present study is not strictly the same, since the troll does not necessarily has the intention of portraying any good will toward the group’s goal of completing the Pokémon game. The intention of creating conflict and frustrating a group of people for personal amusement, though, is very similar. As such, we shall use a less strict definition of trolls, so that we may keep calling them such.
The percentage of people deliberately trolling on the Internet is never clear. Since trolls tend to draw too much attention, it is easy to believe they are more numerous. In the Twitch Plays Pokémon case, this was particularly true: a single input from a troll at the wrong time (or right time, from the troll’s point of view) and the avatar in the game would jump down a ledge, making many more inputs necessary for the avatar to go back to the same coordinate.
THE FIRST SIMULATION MODEL
For the present study, I wanted to know how trolls affected the time for completing Route 23 in Twitch Plays Pokémon. The first step was to develop a simulation model in VBA. A map for Route 23 composed of 305 different coordinates was generated (the same as seen in Tomotani, 2014) and the neighbors for each coordinate were defined. For each coordinate, I defined three different inputs: the “optimal route” (the command which a player wanting to finish the game would input) and two different “troll inputs”. The latter are commands that would make the route as long and frustrating as possible. I defined two different troll inputs because: (a) there were times when two commands could be equally bad; (b) trolls not always want to troll the same way; and (c) to add some variation to the routes’ heat maps presented in this analysis.
The premises to define the commands for the optimal route were:
- Always go through the shortest path towards the objective (the door at the end of Route 23);
- When two commands are equally good, stay away from ledges for as long as possible.
The premises to define the troll commands were as follows:
- If you are close to a ledge you normally would not want to jump over, jump;
- Go away from the direction you are supposed to go;
- Only input “movement” commands (to simplify the model by not having to create simulation models for the game’s menu screen).
Once the simulation model was complete, I defined a “troll factor”, that is, the number of trolls inputting commands. Thus, the troll factor represents the percentage of players that are, in fact, trolls trying to prevent the group from completing the route.
In the simulation, we randomly decided whether the next command would be an “optimal” command or a “troll” command. The chance of the command being a “troll input” was equal to the “troll factor”. Figure 3 shows a heat map of time spent in each coordinate when the troll factor was zero. Since there is no probabilistic factor (that is, all commands made are optimal), this route is always the same: it takes 70 steps to complete this path.
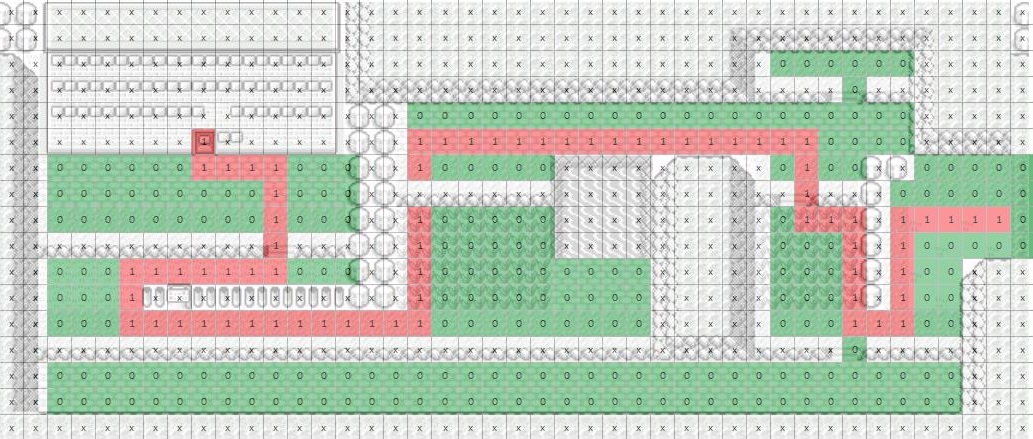
Figure 3. Optimal route, when the troll factor is zero, completed in 70 steps.
Figure 4 shows a heat map of time spent in each coordinate for a simulation run when the troll factor was 10%, that is, on average one out of every ten inputs was made by a troll. In this specific run, it took 285 steps to complete the route, more than four times longer than the optimal path. When tested with a troll factor of 20%, the number of steps necessary reaches the thousands. Figure 5 is an example, where 1,011 steps had to be taken to complete the route.
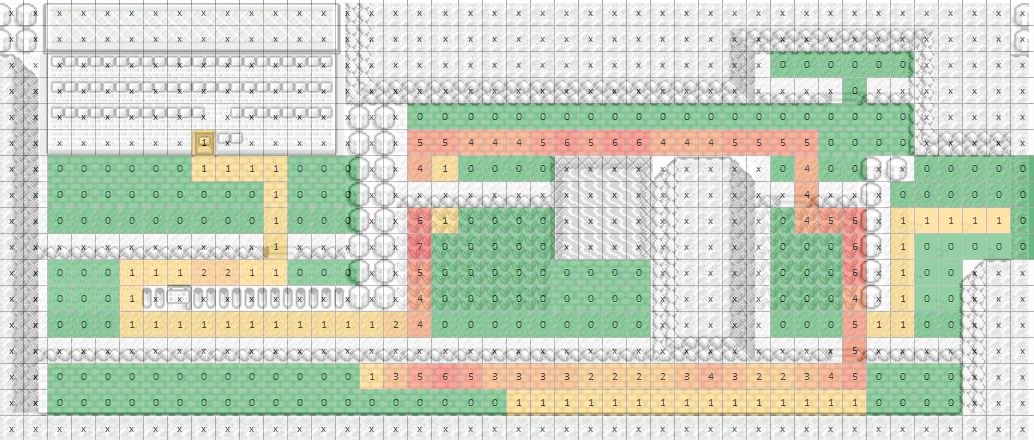
Figure 4. Simulation run with troll factor of 10%, completed in 285 steps.
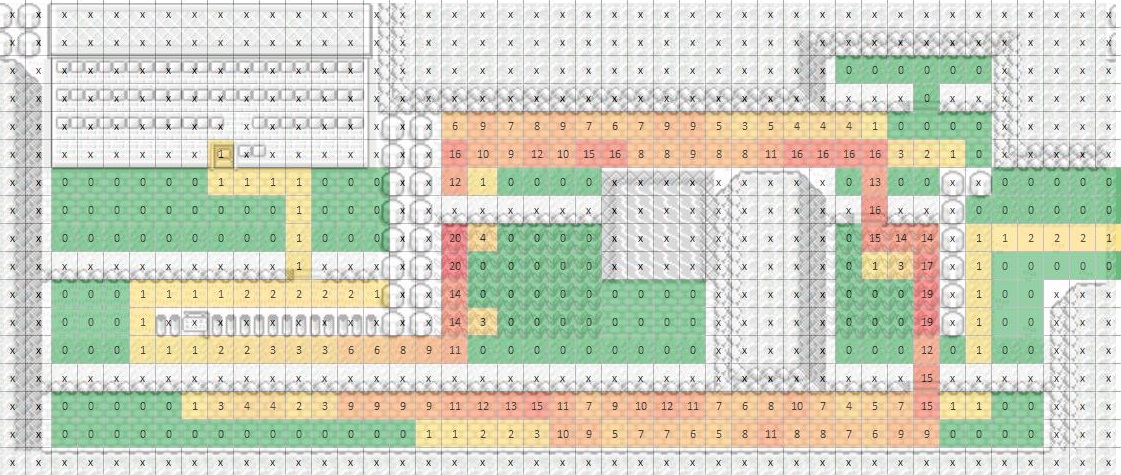
Figure 5. Simulation run with Troll factor of 20%, completed in 1,011 steps.
THE SECOND SIMULATION MODEL
The VBA model, though, proved inefficient when dealing with higher troll factors, constantly crashing or giving inconsistent results. As such, I decided to use a more appropriate tool, and developed a simple Discrete Event Simulation Model on the Rockwell Arena software (ARENA, 2016). This model can be seen in Figure 6. (For more information on simulations with this software, see Altiok & Melamed, 2007; and for more on Discrete Event Simulation, see Banks et al., 2009).
On this simulation model, the coordinates were indexed in a “305 lines x 4 columns” matrix in the software, where each line was a coordinate, and each column contained the possible neighbors. With a “Create” module, 100 entities were inserted simultaneously in the model, each representing a different simulation run. Each entity had an attribute named “position”, where the current coordinate of the simulation was recorded, and a “total steps” attribute, where the number of steps necessary to finish the simulation run was recorded.

Figure 6. Simulation model on Rockwell Arena.
In each step of the simulation, a “Decide” module of the Arena decided whether the next command inserted for each run was a “normal” or a “troll” one, and the “position” attribute of each entity was updated. When the current position of an entity was the coordinate for the door at the end of Route 23, the simulation was terminated and the total number of steps to finish the route was registered. At the end of the simulation, a “Read and Write” module was used to record some additional information at an Excel worksheet, such as number of steps on each cell, and number of steps on each area (more of this below).
To see how the percentage of trolls (“troll factor”) affected the number of steps, I made various simulations. For each troll factor used, I ran 100 simulations and calculated the average number of steps to complete Route 23 (it took a while for the 50% troll factor!). The results can be seen on Table 1 and Figure 7.
Table 1. Average number of steps (out of 100 simulations) necessary to finish Route 23.
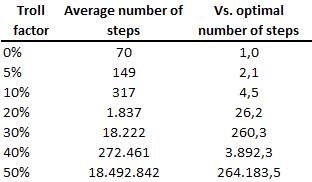

Figure 7. Well, that escalated quickly. (Keep in mind that the Y axis is in logarithmic scale.)
In other words, with a single troll command in every 20, it is already enough to make traversing this map twice as difficult, and when 50% of the inputs were made by trolls (well… in this case it is almost a philosophical question whether the trolls are the ones trying to prevent others from completing the game or the ones effectively trying to complete it), the number of steps necessary was more than 264,000 times greater than the optimal route.
Additionally, I divided Route 23’s map into five different areas (Fig. 8) to analyze how much time was spent in each area for each troll factor. The results can be seen on Table 2 and Figure 9. It is clear that, the greater the troll factor, the easier it is for the avatar of the game to jump over the lower ledge and into “Area 5”, where he spends most of the time. (See the Appendix for heat maps with average results.)
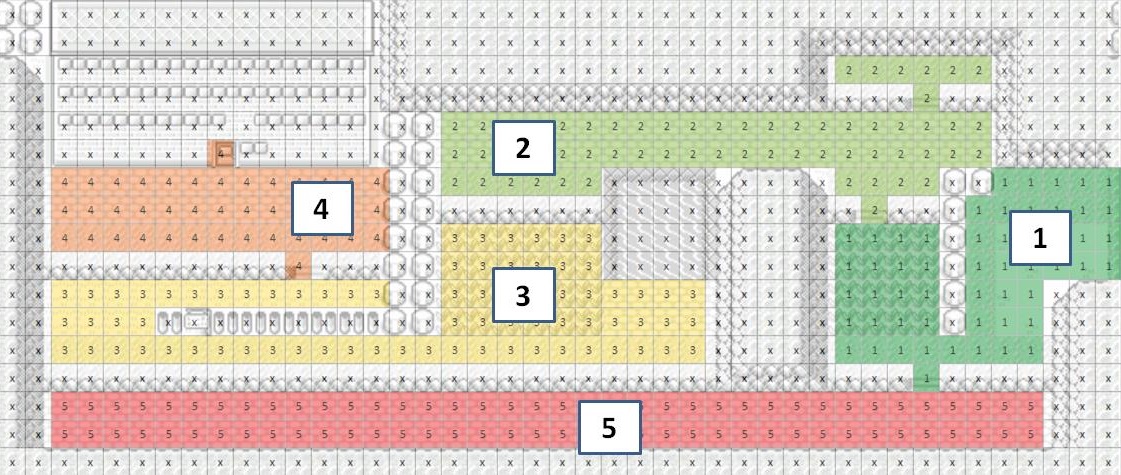
Figure 8. Division of Route 23 into five areas.
Table 2. Percentage of time spent on each of the five Areas for varying troll factors.


Figure 9. Percentage of time spent in each of the five Areas for varying troll factors.
With these results, it is clear that trolls can be a pain whenever you are trying to conduct some nice experiment online, or have a good argument. Herring et al. (2002) speculate about why trolls (or “trollers”, as he puts it) troll, suggesting that the actions may be a result of: hatred towards people who are perceived as different or threatening by the troller (e.g., women or homosexuals); sense of control and self-empowerment when groups are targeted for their vulnerability (such as disabled people or inexperienced users); or simply because trollers enjoy the attention they receive, even (and maybe especially) when it is negative. According to Herring et al. (2002), this suggests that ignoring the troller might truly be an effective way of thwarting him/her (a.k.a. “don’t feed the troll”). Sadly, this is much harder to do in Twitch Plays Pokémon.
AND WHAT ABOUT THE FISH?
Now consider again my previous work (Tomotani, 2014), where I discussed the fish Grayson and his journey to be a Pokémon master. When you think about it, the average number of steps necessary for a simulation with 50% of trolls seems a bit underwhelming. Considering that one command was inputted every 1.5 second, the 18.492.842 steps would be made in 321 days, less than one year, while random commands made by a fish would take more than 115 thousand years.
I tried to validate this number by using my model to simulate Grayson, but it would take way too long. I adapted the model so that, instead of deciding between a “troll” and “normal” input, it chose randomly between any of the four directions (Fig. 10). After ninety minutes and 5 billion steps, the model seemed no closer to concluding its task. A simple calculation showed me it would take close to 30 days to simulate the equivalent of 115 thousand years (not that long in comparison to the 10 million years it took Earth to calculate the question to the ultimate answer).
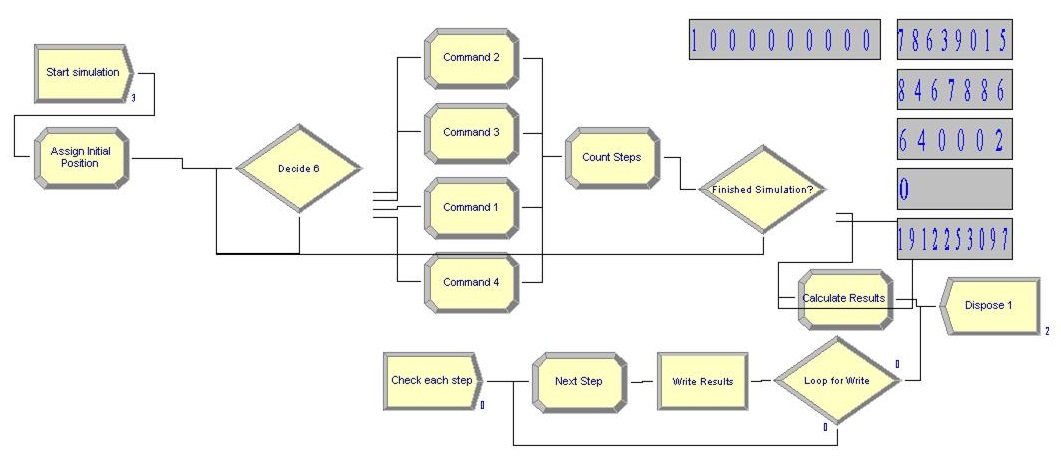
Figure 10. Adapted model for the “random” input. Here, the two “troll inputs” and the “optimal input” from the previous model are substituted by four different commands, one for each direction.
So, I aborted the idea of simulating the whole thing, and decided to limit my simulation. I made 10 simultaneous runs, each with a limit of 1 billion steps, 50 times more than the average it took for the troll factor of 50%. After this limit was reached, the simulation would stop and record the results to show how far the simulation managed to go. Spoiler alert: not a single one managed to finish the route. Figure 11 shows a heat map for this experiment, considering the sum of the 10 simulations, a total of 10 billion steps. Figure 12 gives a closer look at the hardest area to traverse (the narrow path on Area 3), where a single input “down” means lots of backtracking.
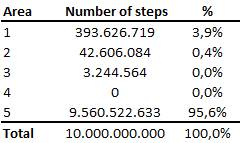
After 10 billion steps, only once the random simulation managed to get to the “signpost” coordinate, and never getting further than that (you can see the actual signpost in Fig. 12). Table 3 shows the distribution of steps in each Area (of those five defined above) by the random simulation. More than 95% of the time was spent in Area 5, the lower part of the map.
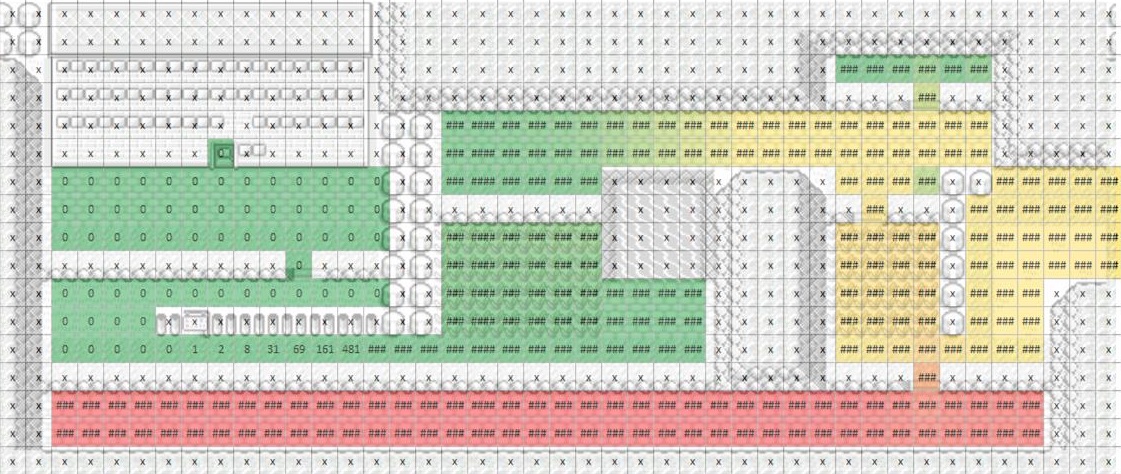
Figure 11. Heat map for the “random” simulation.
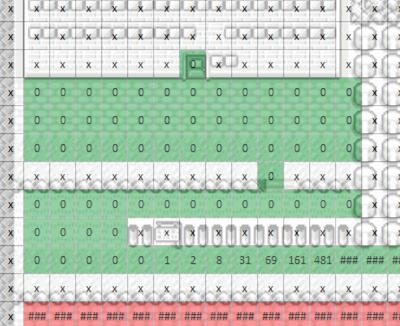
Figure 12. Closer look at the most critical part of the map, a narrow path on Area 3. The number on each coordinate represents the number of steps taken on that coordinate (the “###” represents very large numbers).
Table 3. Steps taken in each area in “random” simulation.
As such, the conclusion of my previous work that a random input of commands to complete the game is not a productive approach seems valid. This might be a possible explanation to the deactivation of the Fish Plays Pokémon channel, so that Grayson could focus his energy in activities that make better use of his skills.
REFERENCES
Alcantara, A.M. (2014) Twitch Plays Pokémon: a social experiment from its creator. Mashable, available from: http://mashable.com/2014/02/ 28/twitch-plays-pokemon/#5nL.FQX07sq3 (Date of access: 11/Sep/2016).
Altiok, T. & Melamed, B. (2007) Simulation Modeling and Analysis with ARENA. Academic Press, Waltham.
ARENA. (2016) Arena Simulation Software. Available from: https://www.arenasimulation. com/ (Date of access: 17/Sep/2016).
Banks, J.; Carson II, J.S.; Nelson, B.L.; Nicol, D.M. (2010) Discrete-Event System Simulation, 5th ed. Prentice Hall, Upper Saddle River.
Haque, A. (2014) Twitch Plays Pokemon, Machine Learns Twitch: unsupervised context-aware anomaly detection for identifying trolls in streaming data. Available from: https://www. albert.cm/dl/twitch_paper.pdf (Date of access: 19/Sep/2016).
Hardaker, C. (2010) Trolling in asynchronous computer-mediated communication: from user discussions to theoretical concepts. Journal of Politeness Research 6(2): 215–242.
Herring, S.; Job-Sluder, K.; Scheckler, R.; Barab, S. (2002) Searching for safety online: managing “trolling” in a feminist forum. Information Society 18(5): 371–384.
Jakobsson, A. (2005) The Good, the Bad, and the Ugly: Bárðar saga and its Giants. Medieval Scandinavia 15: 1–15.
Johns, S. (2014) 20,000 anxiously watch a fish play Pokemon on Twitch TV. Available from: https://www.neowin.net/news/20000-anxiousl y-watch-a-fish-play-pokemon-on-twitch-tv (Date of access: 17/Sep/2016).
Tomotani, J.V. (2014) The infinite fish playing Pokémon theorem. Journal of Geek Studies 1(1–2): 1–8.
Twitch. (2016) Fish Plays Pokemon. Available from: https://www.twitch.tv/fishplayspokemon (Date of access: 17/Sep/2016).
ACKNOWLEDGEMENTS
I am grateful to Henrique M. Soares for proposing this nice topic to study, as well as for suggestions and comments.
ABOUT THE AUTHOR
João Vitor Tomotani is an engineer who likes to make strange models. He refuses to acknowledge any Pokémon game after the Gold/Silver generation.
APPENDIX

Figure A1. Heat map for the average of 100 simulation runs with a troll factor of 5%.

Figure A2. Heat map for the average of 100 simulation runs with a troll factor of 10%.

Figure A3. Heat map for the average of 100 simulation runs with a troll factor of 20%.
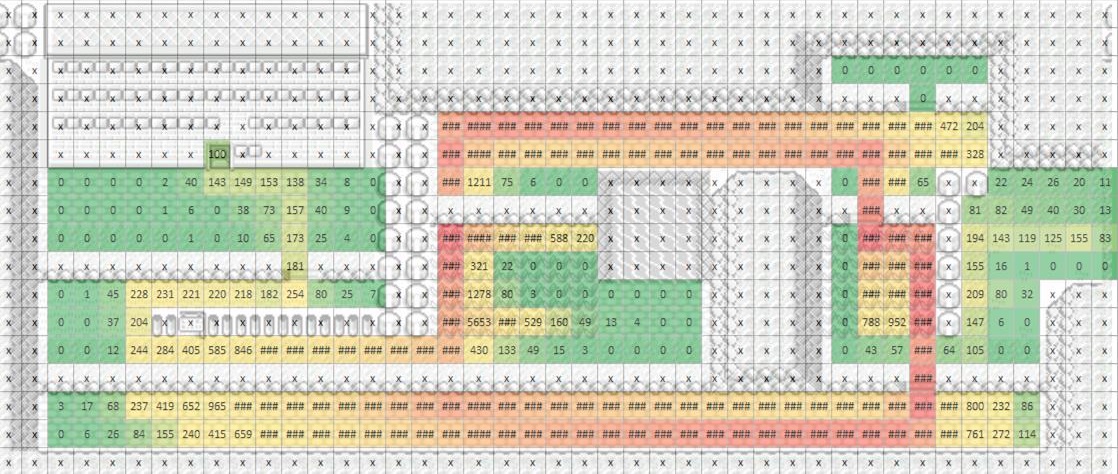
Figure A4. Heat map for the average of 100 simulation runs with a troll factor of 30%.

Figure A5. Heat map for the average of 100 simulation runs with a troll factor of 40%.

Figure A6. Heat map for the average of 100 simulation runs with a troll factor of 50%.
Table A1. Number of total steps on each coordinate for the 100 simulations for varying troll factors (since the table is quite large, please click on the image to see a better resolution).
![]()